Triangles are a correction five-wave pattern (marked as A-B-C-D-E), which is divided into five types. This pattern is formed in a position prior to the final wave in an impulse or a correction. For example, a triangle could be formed in a wave four in an impulse or wave B in a zigzag.
Also, this pattern occurs in final wave X in a double/triple zigzag or three patterns.
- Wave two of an impulse can’t be a triangle.
- Waves A, B and C are usually zigzags, double zigzags, triple zigzags (that’s rare), double and triple threes.
- Waves D and E could be triangles themselves.
Triangle’s classification
On the next picture, you can find all types of triangles (Horizontal, Barrier, Expanding, Running and Skewed). Let’s examine them one by one.
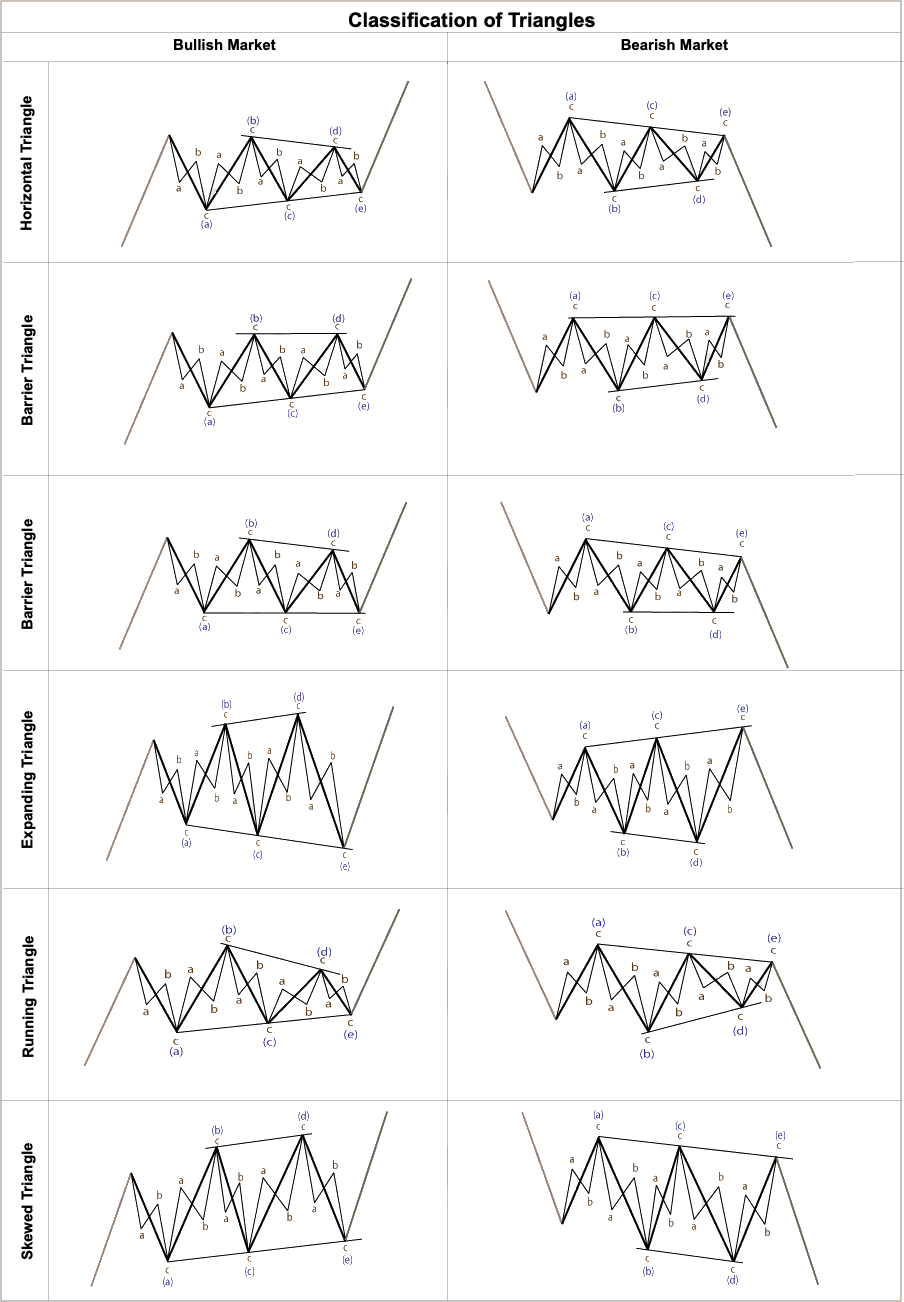
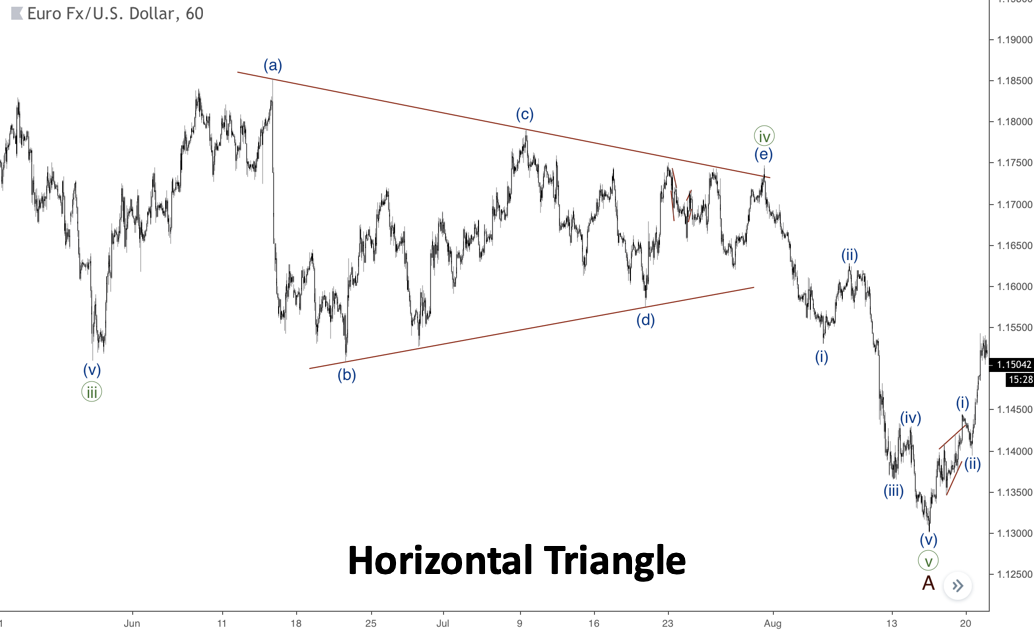
Horizontal Triangle
This pattern is also known as a contracting triangle. As you might guess from the name of this pattern, its lines are aimed towards each other. Each wave of this triangle is shorter than the previous one, which means wave (b) doesn’t break the beginning point of the wave (a), wave (c) doesn’t break the starting point of the wave (b) etc. On the next chart, you can see a triangle in the position of the fourth wave, so a five-wave decline happened right after the pattern.
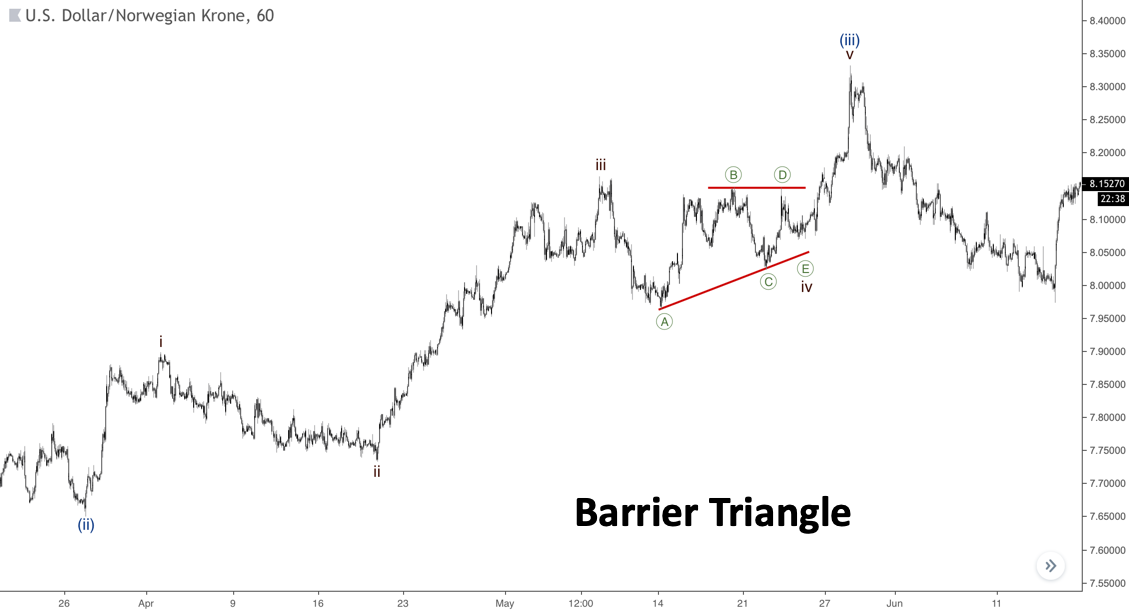
Barrier Triangle
The only difference from the contracting triangle is that the line B-D or A-C-E is horizontal. The other one goes towards a horizontal line, so a Barrier Triangle is a variation of the contracting pattern. You can find an example of this pattern on the chart below.
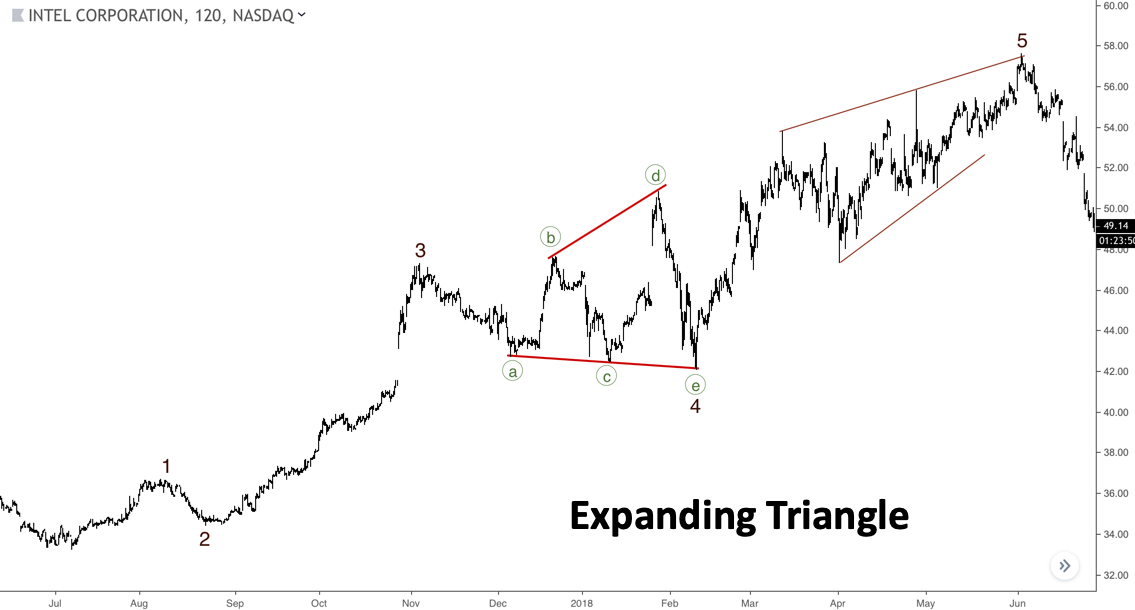
Expanding Triangle
This triangle is the trickiest one. It’s simply impossible to predict this pattern from the beginning, so we could count it only when the wave E finishes. Both lines of the pattern are directed in the opposite direction.
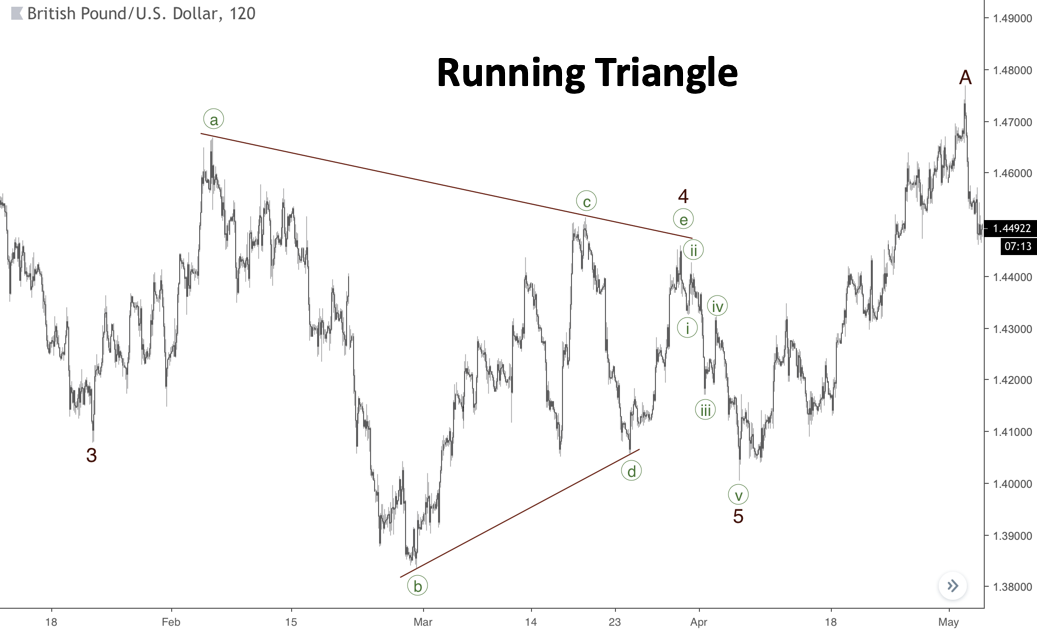
Running Triangle
Sometimes, the wave B of a triangle could be longer than wave A, but all other waves are smaller from the one before. The next chart shows an example of a Running Triangle in the position of the fourth wave. As you can see, wave ((e)) of the pattern doesn’t reach the upper side of the triangle. This happens quite often, so we should always consider the structure of the wave E to predict its ending.
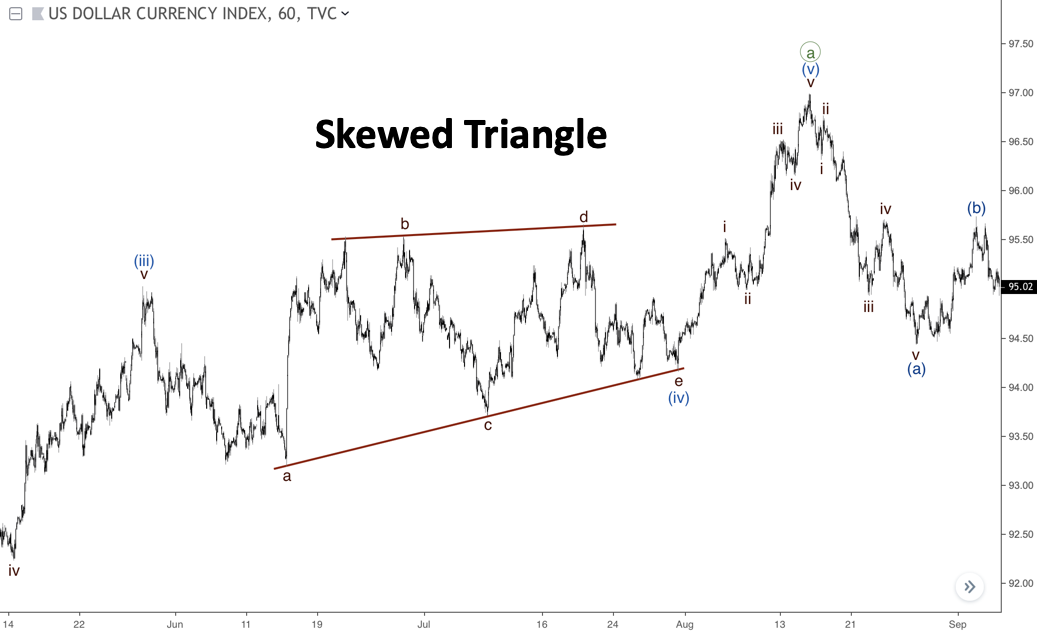
Skewed Triangle
If a very strong trend takes place, we could face a Skewed Triangle, its wave D is longer than wave B. So. It’s the only type of triangle, which has a direction towards the main trend. This pattern is rare and we should mark it as the last possible scenario. The following chart represents a Skewed Triangle, which pushed the price higher into the fifth wave.
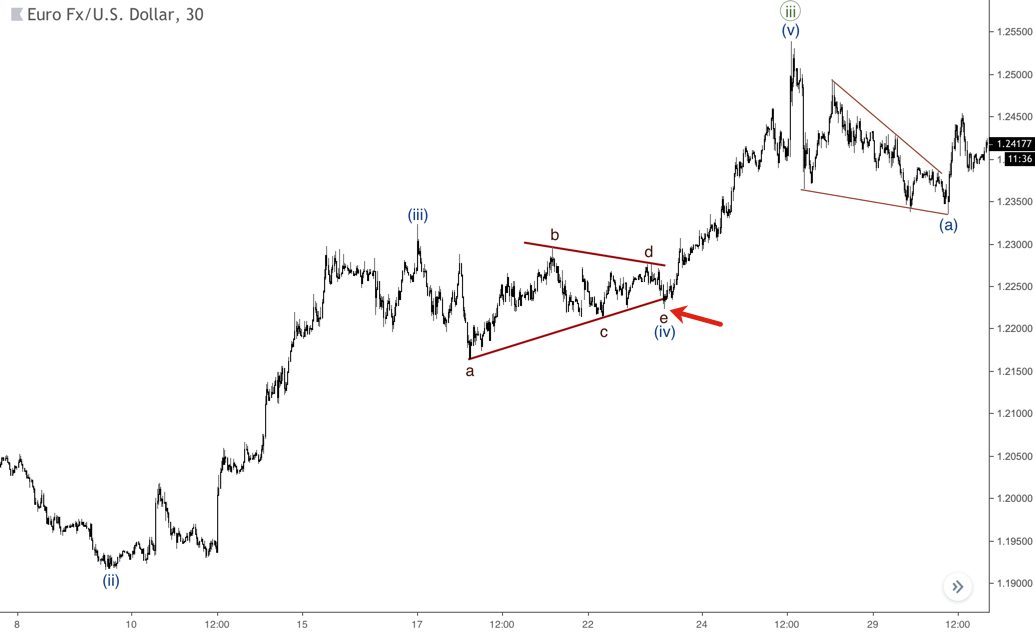
Other examples: Ending of wave E
It’s possible for the wave E to break the A-C line of a triangle. If this happens, it’s important to wait for the price to come back into a range of the pattern. As you can see on the chart below, the pair tested the triangle’s lower side, but a subsequent pullback from it led to the beginning of the fifth wave.
Massive fifth wave
From time to time, the market could move pretty fast right after a triangle. The next chart shows that case. The ending of the wave ((iv)) as a triangle turned out to a huge rally in wave ((v)). As far as we know that a triangle forms prior to the final wave in an impulse, we should expect a correction after the rally. Note that there’s also a small triangle in wave (iv) of ((iii)).
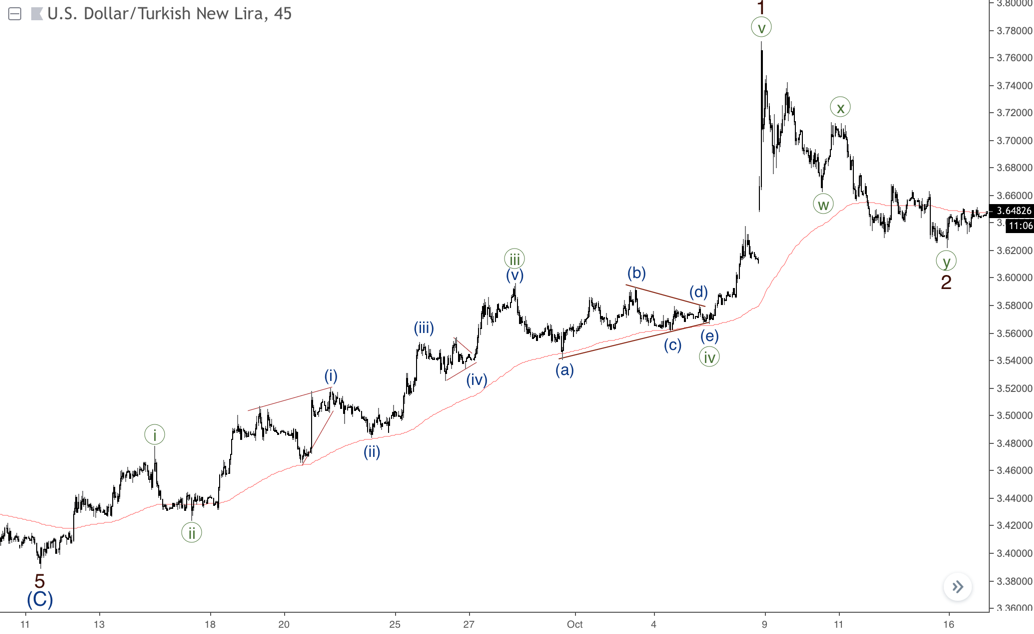
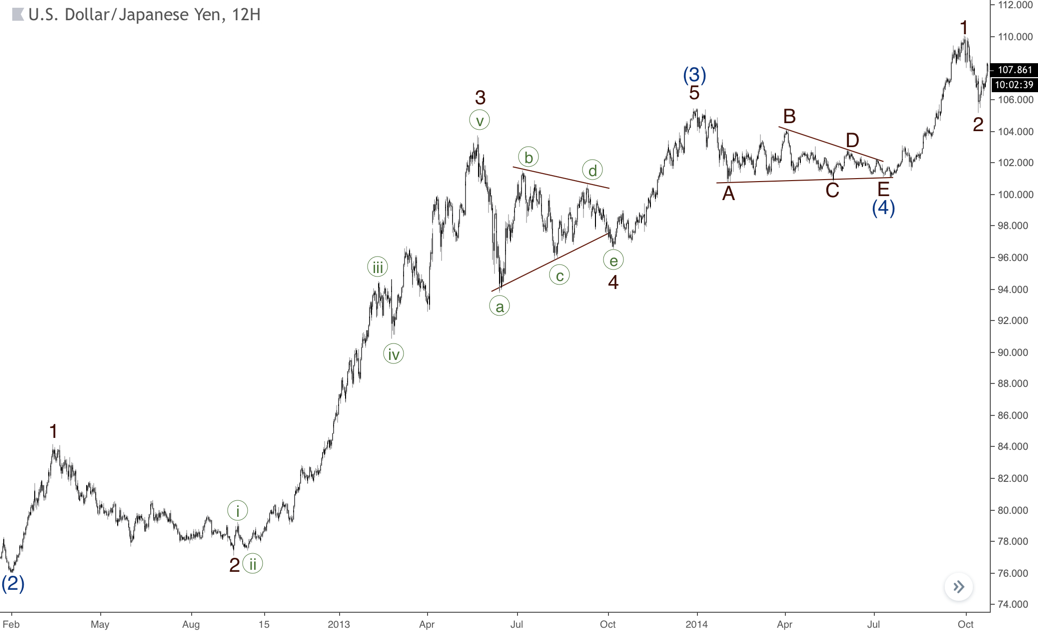
Two triangles
If an extension in the third wave takes place, it’s possible to wave two triangles in a row, which could be formed in a position of the fourth waves from different degrees. You can find an example of such a case on the last chart. Wave 4 of (3) is formed as a triangle, but right after the wave 5 of (3) the market developed another triangle in wave (4).
The Bottom Line
There are a few different shapes of triangles. This pattern is the last correction in impulsive or corrective structures. We could count a triangle only when its structure is fully completed.