In trading, some signals are loud and clear. Others are more subtle, like a pause in conversation that says more than words. The Gravestone Doji falls into that second category.
It’s just one candle, but it can quietly hint that bullish momentum is fading and a reversal may be on the horizon. For traders who know how to read it, this pattern can offer a valuable heads-up.
What is a Gravestone Doji
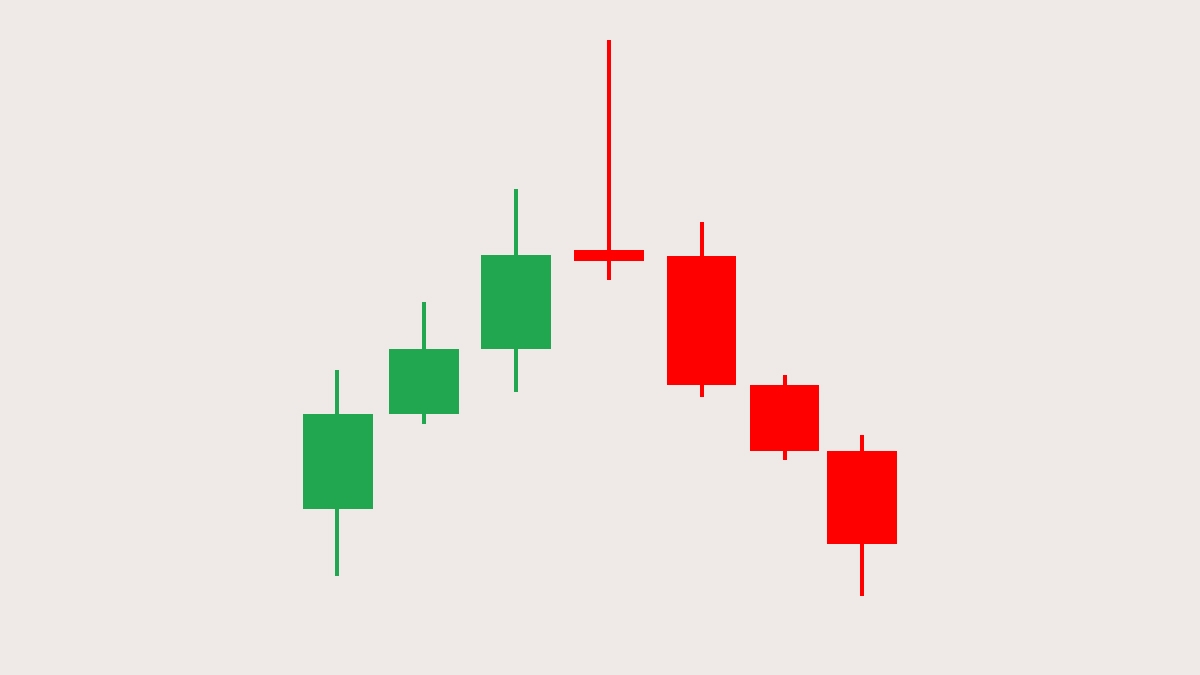
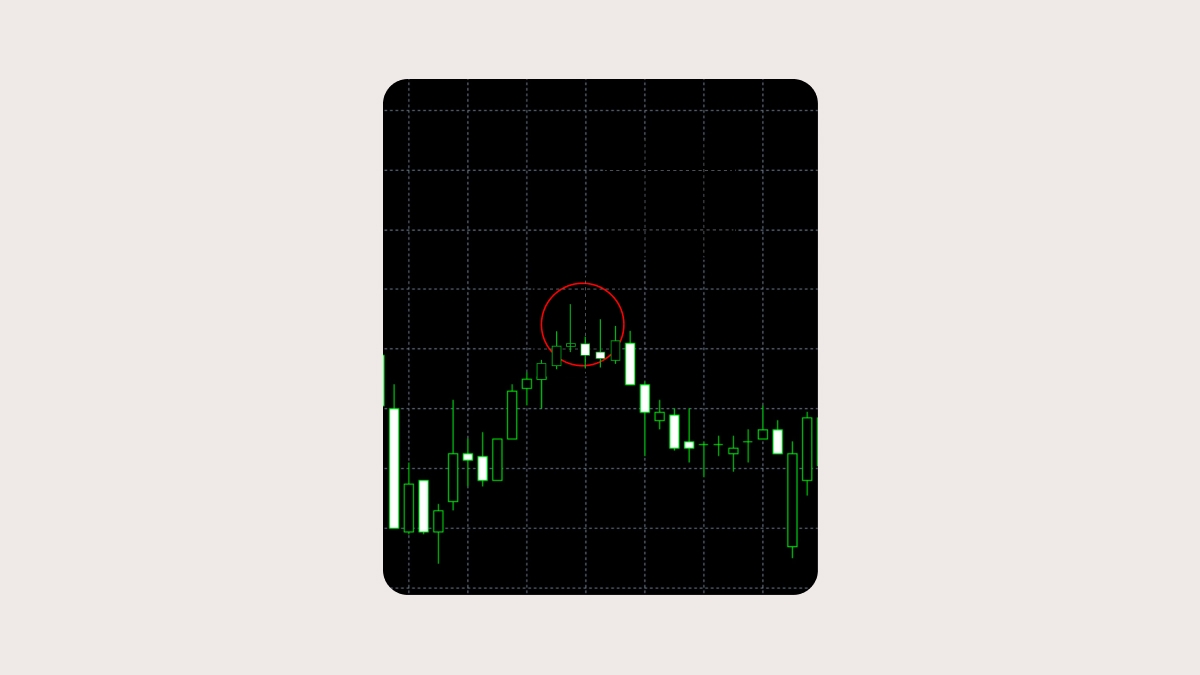
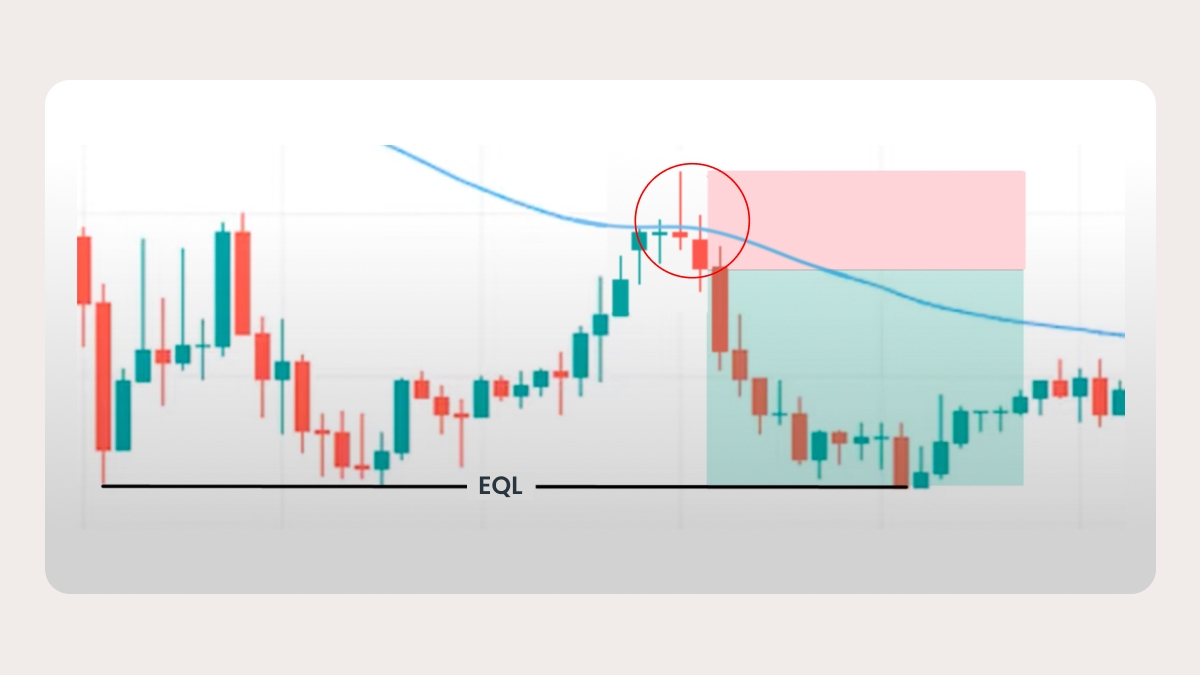
The Gravestone Doji is one of those patterns that can quietly hint at trouble after a bullish run. It tends to pop up near the top of an uptrend and suggests that buyers might be running out of steam.
You’ll recognize it by its shape: a long upper wick and a tiny (or nonexistent) body sitting at the bottom. The open, low, and close prices are all close together, which gives the candle its flat base, like an upside-down T.

But the real story is in what it tells us: buyers managed to push the price way up during the session, but couldn’t hold it. By the close, sellers had completely wiped out those gains, dragging the price right back down. That kind of rejection at the top often signals a shift in mood.
Best timeframes to watch
The Gravestone Doji can pop up on pretty much any chart, whether you’re looking at one-minute candles or scanning monthly price action. But here’s the thing: not all appearances are equally meaningful.
On short timeframes, like 5-minute charts, it might just be noise. Maybe the market hesitated for a moment, or there was a quick reaction to some small headline, and suddenly you have what looks like a textbook Gravestone. In reality, though, it might not mean much. These fast charts tend to be choppy, and patterns can be misleading if taken too literally.
If you spot the same pattern on a daily or weekly chart, that’s a different story. It starts to matter more. You’re looking at broader price behavior, and that kind of signal can be a clue that momentum is slowing down, especially if it shows up after a strong upward move and right around a resistance area that’s held in the past.
How to identify a Gravestone Doji on a chart

You don’t need fancy indicators to spot a Gravestone Doji. You just need to know what to look for:
The open, low, and close are all nearly equal, creating a flat base.
The upper wick is long, showing that the price was pushed up during the session.
The lower wick is either very short or completely absent.
