FBS turns 16

Unlock birthday rewards: from gadgets and dreams cars to VIP trips.Learn more
Open account
Open accountLog In
Open account

May 15, 2025

Strategy

Opening Range Breakout Trading Strategy

Opening Range Breakout Trading Strategy

Trading strategies are essential to any trader who wants to profit, as they provide the consistency necessary for making good trading decisions. Today we will tell you about one of the most important reversal and continuation chart patterns for the stock market – opening range breakouts. We will give you a history of trading strategies based on this pattern, a number of examples, and several useful hints. Let’s go!

What are Opening Range breakouts?

The opening range is the space between the high and the low of the price for a given period after the market opens. Usually, this period is less than an hour long, and the opening range breakout (ORB) strategy uses these levels as entry points. Generally, traders use 5-, 15-, and 30-minute timeframes to trade ORB.

For example, if you are defining and trading the 15-minute opening range of Apple stock, then you are evaluating the high-low range of APPLE from the opening bell to 15 minutes after it. Within this opening range, the two most important levels that you would be watching would be the high and the low price within the first 15 minutes. Look at the figure to get the idea more clearly.

image_01.jpg

Here you can see that the trading session started with a gap in price. We are using a 15-minute opening range for SPCE stock, so we need to look at the M5 chart. After the price has created an opening range, we can look for entries on the breakout.

The ORB analysis tends to work best on markets that have a clearly defined opening and closing time, like stocks. The US stock market opens at 16:30 GMT+2 or +3, five days a week, so you can prepare for trading and don’t have to worry about missing the trade.

Remember, the US switches time twice a year - an hour ahead in the spring, and an hour back in the fall. These switches happen on different dates every year, so be sure to watch for what time it is in the US.

History of ORB

The strategy was invented back in the 1960s by the famous American trader and investor Arthur Merrill, who used it for almost 20 years to trade the Dow Jones Industrial Average (DJIA) index. Although the strategy has some variations in it, the basis remains the same. To find an opening range, some traders use a short-term moving average, most commonly a three-day average.

Another well-known trader, Sheldon Knight, used the percentage of the difference between an N-day high and N-day low to find a range. We prefer to keep things as simple as we can. Thus, using the short-term averages or highs and lows of a certain day is less effective than using price action at the start of the trading session.

Opening range breakout size

There are two ways of measuring the size of the ORB. Here is the first one: the first candle is the last one from the trading session of the previous day. The second candle is the first one created when the market opens. To get the range size you need to take the high/low of the previous closing and the high/low of the day’s opening candle. The distance between these two prices is the size of the opening range.

Here’s how we measure the size of a range:

image_2.jpg

The other way of measuring the ORB is the high and low of a given period after the market opens. This period is generally the first 30 minutes or the first hour of trading.

During this period, you want to identify the high and low of the day. In addition, you will also want to account for the pre-market highs and lows, as these levels will often act like a magnet for price action after the bell rings. Let’s look at the same figure with a different measure.

image_3.jpg

Opening range breakout calculator

As you already know, the most important part of opening range trading is the breakout. What you probably don’t know is that you can use an ORB calculator to help you find trading opportunities and use them in your favor. You can Google “Opening Range Breakout Calculator” to find one of these sites.

These sites calculate the high and the low of the opening range for you, so it should be easier to start trading. However, we strongly recommend you watch our Gap and Go video because in it you will find several tools that will help you look for gaps in price. Thus, it will be much easier for you to set ORB levels.

ORB trading strategy

The strategy consists of several steps:

  1. Look for gaps in stock prices. Gap scanners are available online for free, so this shouldn’t be hard. In addition, you can watch our Gap and Go video. It will provide more information about gap searching.

    image_4.jpg
  2. After you find a suitable gap, open the chart of a stock and wait for the start of the trading session. For US stocks, the action begins at 16:30 GMT+2 from September to March, and at 16:30 GMT+3 from March to September.

    image_5.jpg
  3. Depending on the timeframe you have chosen, wait for the first 4-6 candles to close. Usually, traders choose five-minute candles. Then, define the high and the low of the range like we did earlier in this tutorial.

    image_6.jpg
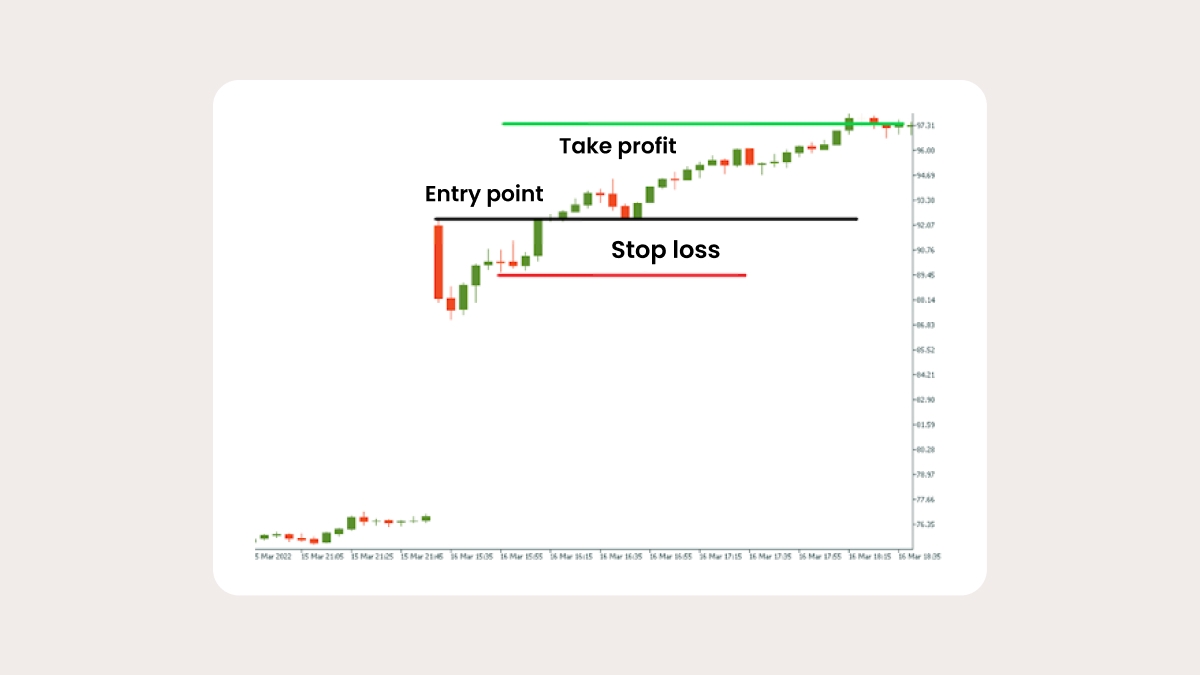
  4. On the breakout of the range, you enter the trade in the direction of movement. Your stop-loss should be in the range (below the range high for long trades and above the range low for short trades). To maintain good risk management, the take-profit is usually placed twice as far as the stop-loss.

    image_7.jpg

Tips for better trading:

  • Close part of your trade on the halfway point to the take-profit. This way, your trade will become risk-free. It will help you withstand times when trades go wrong.

  • Don’t enter a trade you are not sure about, or you will become nervous and less focused.

  • Wait for the candle to close above the opening range to avoid false breakouts.

Share with friends:

Open an FBS account

By registering, you accept FBS Customer Agreement conditions and FBS Privacy Policy and assume all risks inherent with trading operations on the world financial markets.

FBS at social media

iconhover iconiconhover iconiconhover iconiconhover icon

Contact us

iconhover iconiconhover iconiconhover iconiconhover icon
store iconstore icon
Get on the
Google Play

Trading

Company

About FBS

Legal documents

Company news

FC Leicester City

Help Center

Partnership programs

The website is operated by FBS Markets Inc.; Registration No. 000001317; FBS Markets Inc. is registered by the Financial Services Commission under the Securities Industry Act 2021, license number 000102/31. Office Address: 9725, Fabers Road Extension, Unit 1, Belize City, Belize.

FBS Markets Inc. does not offer financial services to residents of certain jurisdictions, including, but not limited to: the USA, the EU, the UK, Israel, the Islamic Republic of Iran, Myanmar.

Payment transactions are managed by HDC Technologies Ltd.; Registration No. HE 370778; Legal address: Arch. Makariou III & Vyronos, P. Lordos Center, Block B, Office 203, Limassol, Cyprus. Additional address: Office 267, Irene Court, Corner Rigenas and 28th October street, Agia Triada, 3035, Limassol, Cyprus.

Contact number: +357 22 010970; additional number: +501 611 0594.

For cooperation, please contact us via [email protected].

Risk Warning: Before you start trading, you should completely understand the risks involved with the currency market and trading on margin, and you should be aware of your level of experience.

Any copying, reproduction, republication, as well as on the Internet resources of any materials from this website is possible only upon written permission.

The information on this website does not constitute investment advice, a recommendation, or a solicitation to engage in any investment activity.