Main idea
The EMAs crossings are used to define the trend.
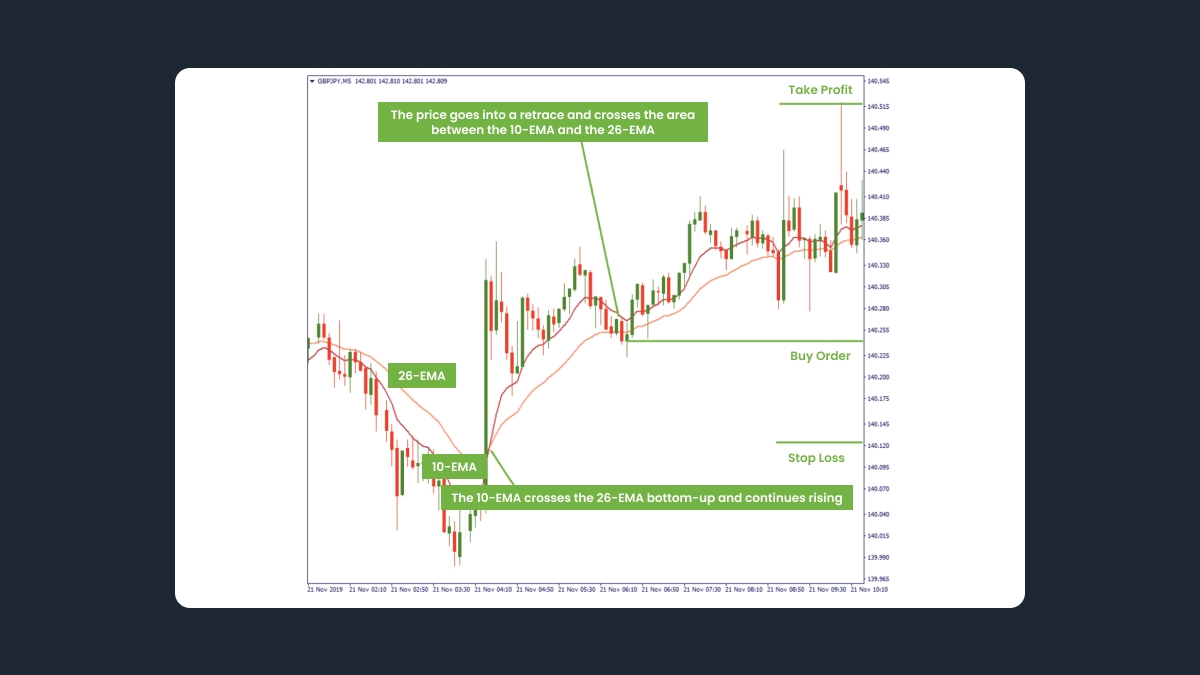
If the 10-EMA crosses the 26-EMA bottom-up and continues rising, it is a sign of an uptrend.
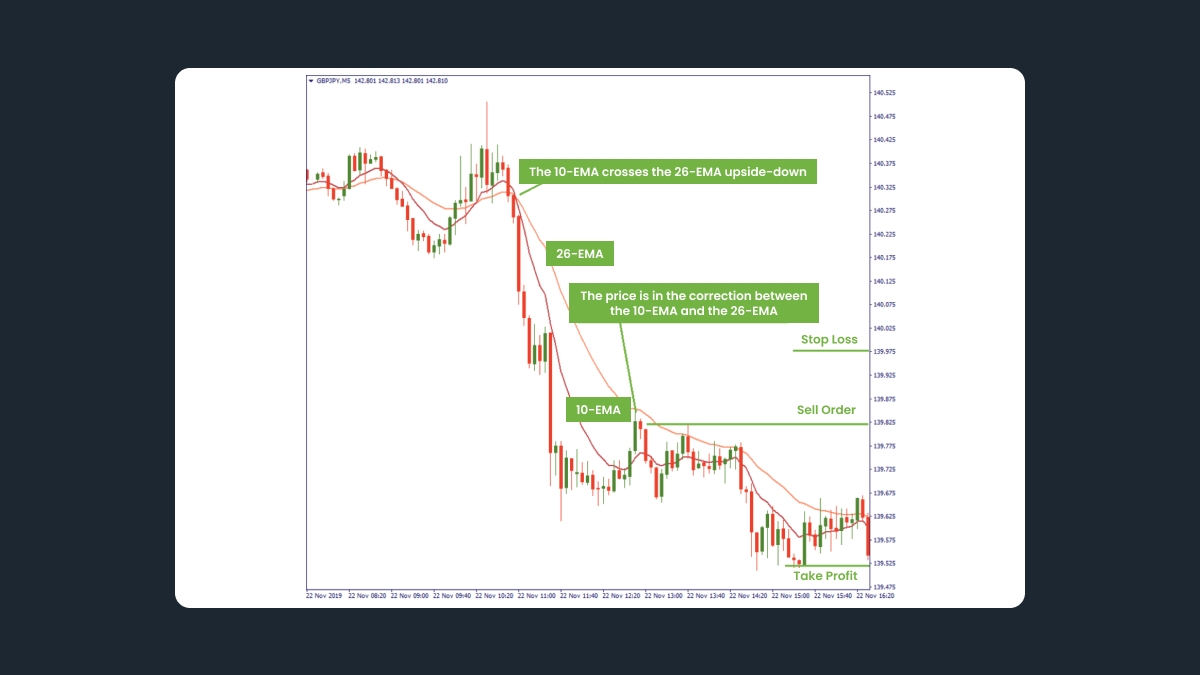
If the 10-EMA crosses the 26-EMA upside-down and continues falling, there is pressure down on the price.
Opening and closing trades
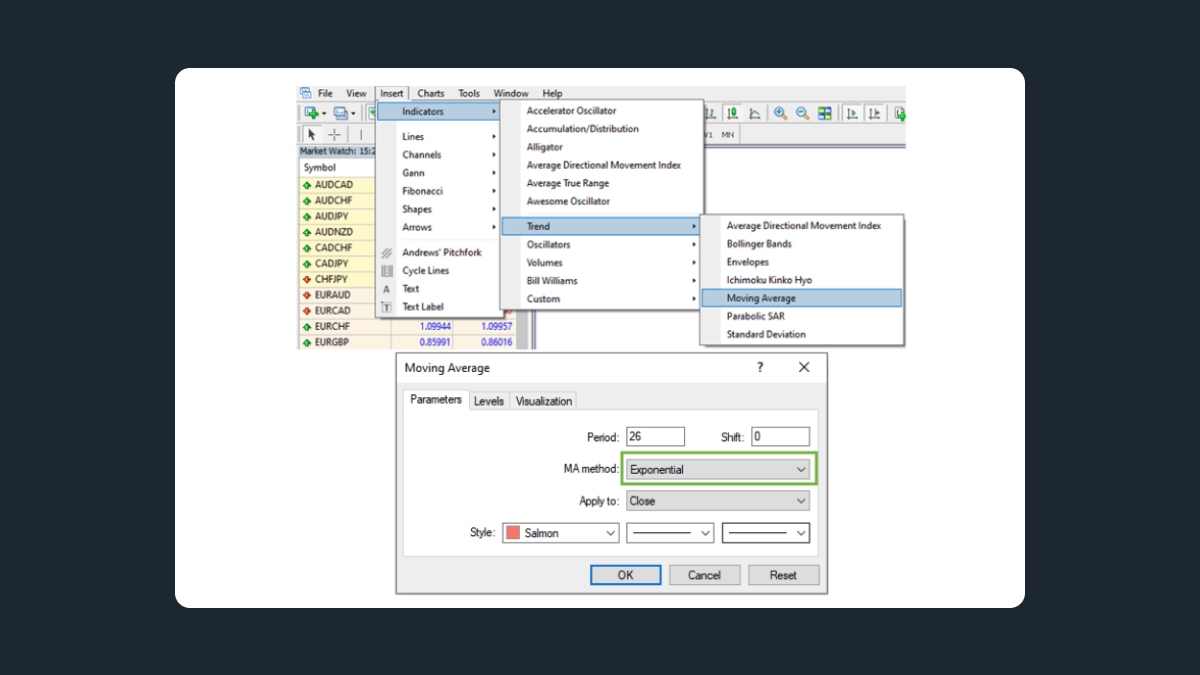
Step 1
You wait for the 10-EMA to cross the 26-EMA. That will give you the indication to prepare to open a position. Moreover, the way the 10-EMA crosses the 26-EMA defines the direction of trade opening, as will be explained in the scenarios below.
Step 2
You wait for the price to follow the direction indicated by the EMAs to confirm your market interpretation.
Step 3
You wait for a local correction against the observed trend. You will open a position at the high/low of this retrace. Your intention here will be to catch the range that the price will go through after getting out of the correction and following the observed trend again.
Examples are below.
Examples
Short position
On the M5 chart of GBPJPY, we observe a downtrend. In addition, we see that the 10-EMA has crossed the 26-EMA upside-down and continued going down. Therefore, we decide to sell on the falling trend.
However, we do not sell immediately. Instead, we wait until the price moves up in a correction to reach at least the middle point between the two EMAs. Now we place a sell order.
The stop-loss should be placed 15-20 pips above the sell order level. The take-profit is 30-40 pips.
Long position
The same logic is applied to the rising market.
On the M5 chart of GBPJPY, we observe an uptrend. Also, we see that the 10-EMA has crossed the 26-EMA bottom-up and continued rising. Therefore, we decide to buy on the rising trend.
However, we do not buy immediately. Instead, we wait until the price moves down in a correction to reach at least the middle point between the two EMAs. Now we place a buy order.