Fundamental Analysis
The EURGBP pair has remained in a downtrend in February 2025, influenced by several economic and political factors. Here are the key reasons behind this trend:
- Divergent Monetary Policies: The Bank of England (BoE) has taken a more aggressive stance compared to the European Central Bank (ECB). Although both banks have implemented rate cuts, the BoE has been more cautious in its approach, strengthening the British pound against the euro.
- Economic Growth and Political Stability in the UK: The UK has shown signs of economic recovery and political stability, especially after the government’s commitment to increase military spending to 2.5% of GDP by 2027. This measure has boosted confidence in the British economy, reinforcing the pound’s strength.
- Uneven Economic Performance in the Eurozone: The Eurozone faces economic challenges, including slower growth in key economies like Germany. The recent victory of conservatives in the German elections has raised expectations for reforms, but complex coalition negotiations could delay their implementation, weakening confidence in the euro.
- Geopolitical and Trade Factors: US trade policies, such as imposing tariffs on various countries, have influenced currency markets. While the UK might avoid some of these tariffs, the European Union continues to face challenges in this area, negatively impacting the euro compared to the pound.
In summary, combining a more restrictive monetary policy by the BoE, stronger economic recovery in the UK, financial challenges in the Eurozone, and geopolitical factors have contributed to the EUR/GBP downtrend in February 2025.
Technical Analysis
EURGBP, H3
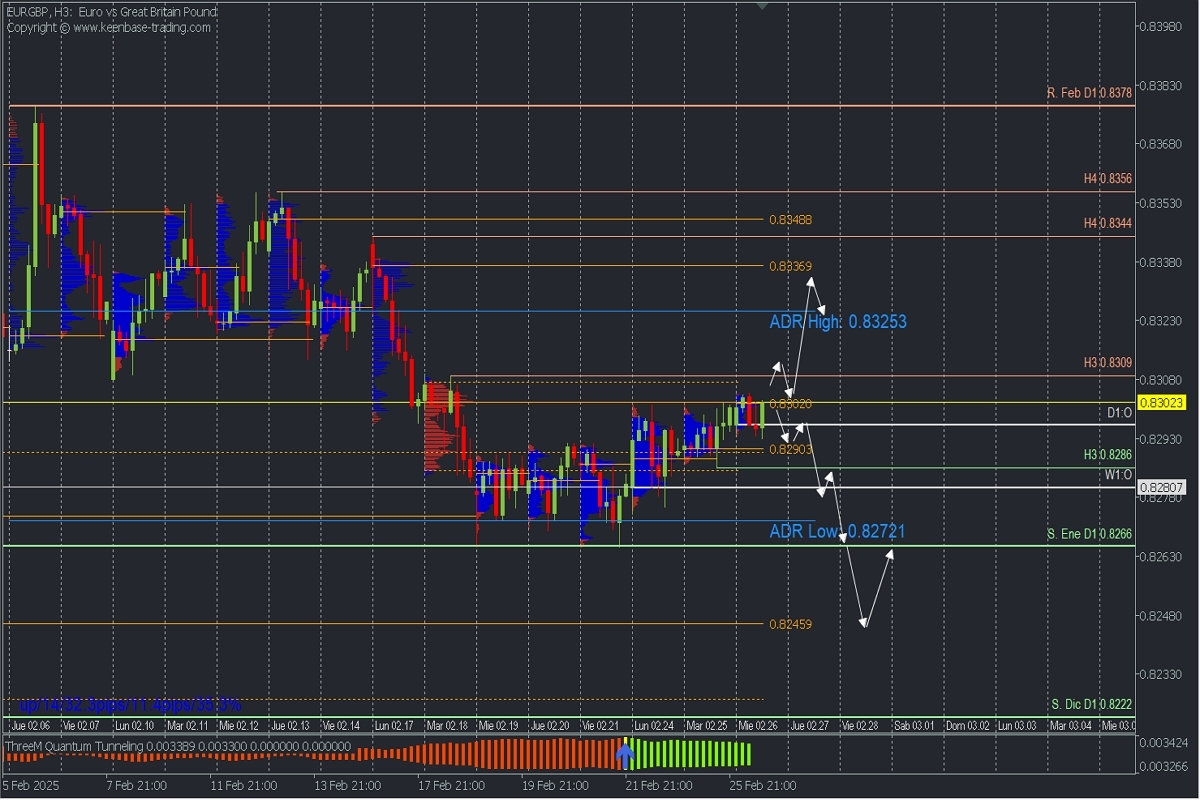
- Supply (Sell) Zones: 0.8302 // 0.8336 // 0.8348
- Demand (Buy) Zones: 0.8290 // 0.8272 // 0.8245
The pair maintains a multi-year downtrend. While it attempts to break daily highs in each cycle, these moves are not sustained, and prices fall again. This was the case with the January high, which triggered a daily trend reversal but quickly resumed the downtrend by January 24.
Currently, a bullish correction is underway after bouncing from the January support at 0.8266. It has reached the supply zone from Tuesday 18th around 0.8302, just below the last confirmed intraday resistance at 0.8309.
This supply zone may act as resistance, with bears defending it to trigger another price decline and continue the broader downtrend. A confirmed break below the local demand zone—at the uncovered POC* from yesterday around 0.8290 and the key correction support at 0.8286—would open the way toward the weekly open (W1:O) at 0.8280 and the daily bearish range at 0.8272, ultimately targeting the next uncovered POC and demand zone at 0.8245.
However, the bearish scenario would be invalidated if the price breaks the 0.8309 resistance decisively (two bullish moves with candle bodies), allowing an intraday rally toward the bullish range at 0.8325 and the next supply zone around 0.8336.
Technical Summary
- Bearish Continuation Scenario: Sell below 0.83, targeting 0.8290, 0.8286, 0.8272, and extended to 0.8245.
- Bullish Scenario: Buy if the price decisively breaks the 0.8309 resistance (confirmed by candle bodies), with targets at 0.8325 and 0.8336, where new selling opportunities may arise.
Always wait for the formation and confirmation of an Exhaustion/Reversal Pattern (PAR) on M5, like the ones we teach here https://t.me/spanishfbs/2258, before entering trades at the key zones indicated.
* Uncovered POC (Point of Control): The level where the highest volume concentration occurred. If a downward move followed, it is considered a selling zone (resistance). Conversely, if an upward move followed, it is considered a buying zone (support).


