Summary;
- Current ECB Interest Rate: 3.00% (after 7th rate cut in a year)
- Rate Cut Probability (June Meeting): Rising but data-dependent
- EURUSD: Firming against USD, driven by lower U.S. yields and stronger euro zone data
- Energy Prices: Falling, easing inflation pressures
Fundamental Factors Affecting the Eurozone
- Inflation Forecasts Revised Higher, Then Back to Target
- 2025 CPI forecast: 2.2% (up from 2.1%)
- 2026 CPI forecast: 2.0% (up from 1.9%)
- ECB view: The disinflation path is intact, but external risks (e.g., U.S. tariffs) complicate the picture.
- Projections may already be outdated, as they pre-date recent market shifts (cutoff: April 4th).
- EUR Strength & Energy Price Drop May Offset Inflation
- A stronger euro dampens import-led price pressures.
- Falling oil and gas prices reduce headline inflation potential.
- These factors may negate upside inflation risks seen in earlier forecasts.
- Trade Tensions with the U.S. Cloud Outlook
- Ongoing tariffs and trade friction could suppress growth and slow inflation further.
- Lagarde warned a full-blown trade war could cut Eurozone GDP by 0.5%.
- Yet the ECB’s SPF only modestly reduced the 2025 growth forecast to 0.9% (from 1.0%), suggesting that more downside revisions may follow.
- ECB’s Policy Flexibility Maintained
- Despite multiple cuts, policymakers are cautiously data-driven, not committed to a fixed path.
- Lagarde signaled future decisions would balance inflation trajectory vs. external risks.
Key Takeaway for Traders
- Short-term: EUR strength may hold if inflation stays sticky and U.S. risks persist.
- Medium-term: If trade tensions escalate and growth slows, the ECB may pause or slow rate cuts, giving the euro further support.
- Long-term: If inflation stabilizes near 2% and growth remains soft, the ECB may remain dovish, capping the euro upside.
- FX Impact:
EURJPY – H4 Timeframe
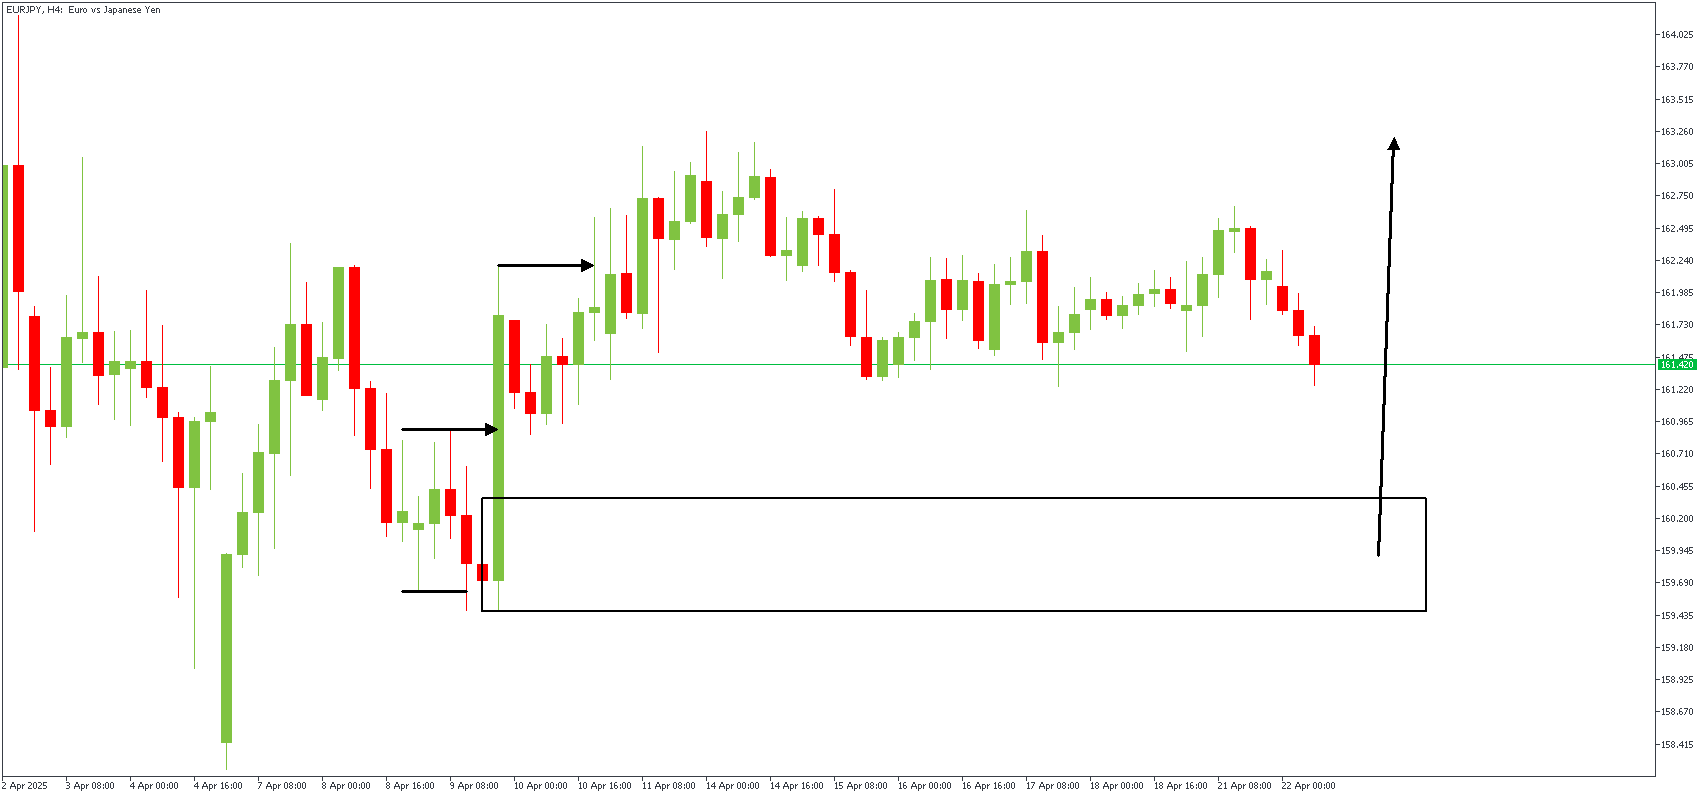
Price action on the 4-hour timeframe chart of EURJPY failed to create a higher high after completing the double break of structure, indicating that the price would need to seek out a proper area of demand to form the higher low. The demand zone below the Fair Value Gap seems perfect, owing to an inducement and the SBR pattern.
EURJPY – H2 Timeframe
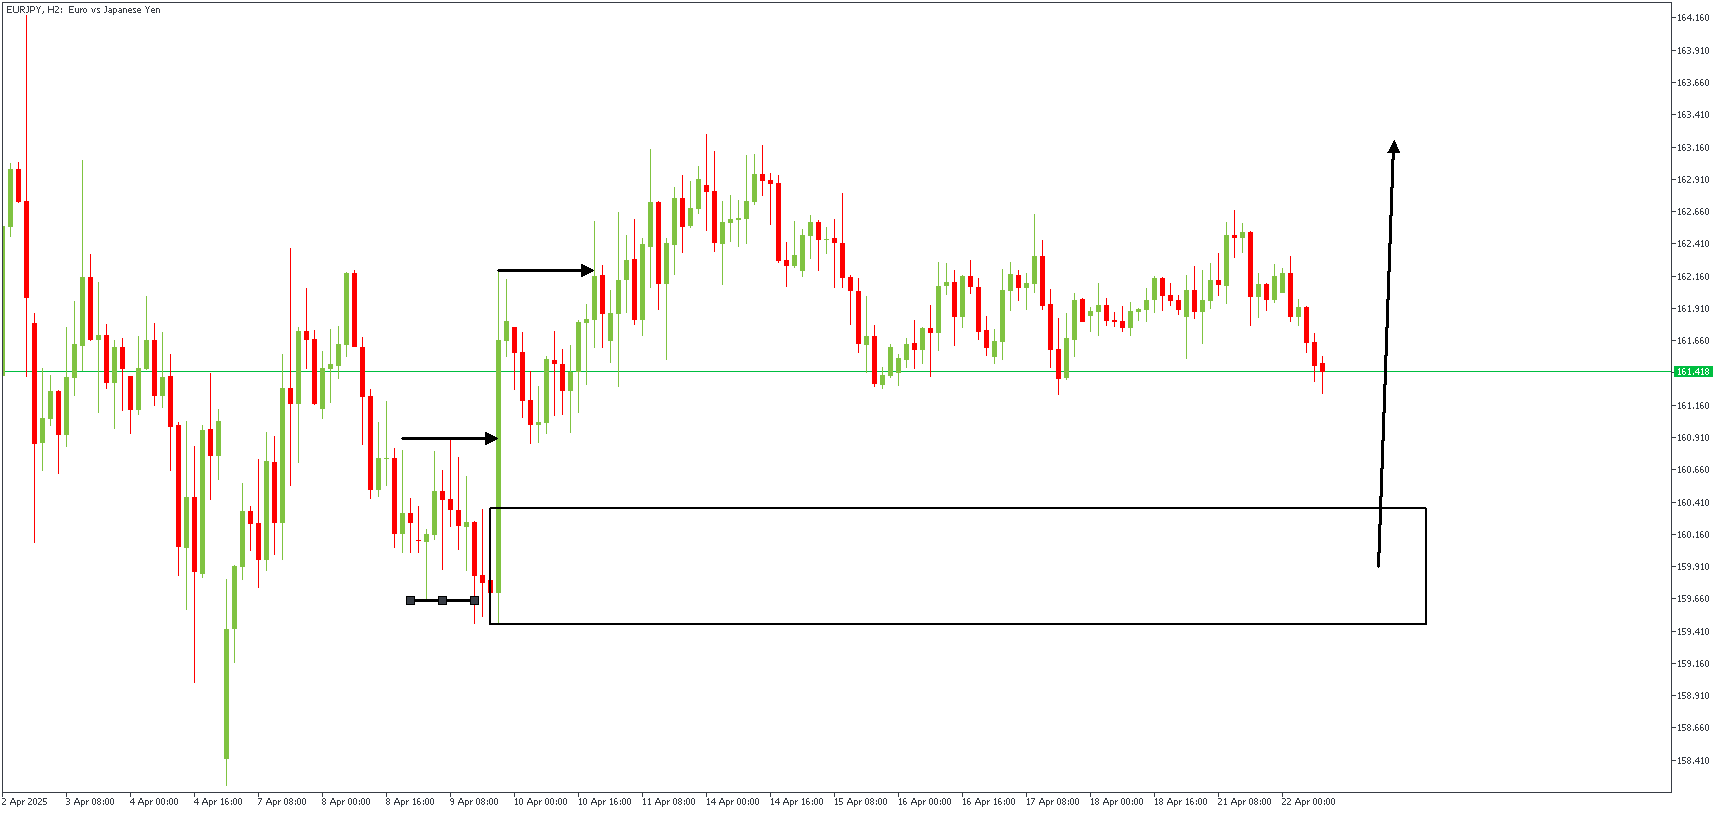
The 2-hour timeframe chart of EURJPY contributes details to the SBR pattern, showing the bearish sweep, the bullish break of structure, and the likely area of demand for the bullish continuation. I’m sure this demand zone falls between 76% and 88% of the optimum Fibonacci retracement zone. The sentiment is, therefore, bullish.
Analyst’s Expectations:
Direction: Bullish
Target- 163.226
Invalidation- 159.144
CONCLUSION
You can access more trade ideas and prompt market updates on the telegram channel.


