Fundamental Analysis:
The Reserve Bank of Australia will meet on February 17 and 18, and a rate cut is expected as recent inflation data shows that inflation is approaching the RBA's target faster than previously anticipated. This scenario puts pressure on the AUD as the Fed is not considering rate cuts in the short term, which will continue to support USD buying.
Technical Analysis
AUDUSD, Daily
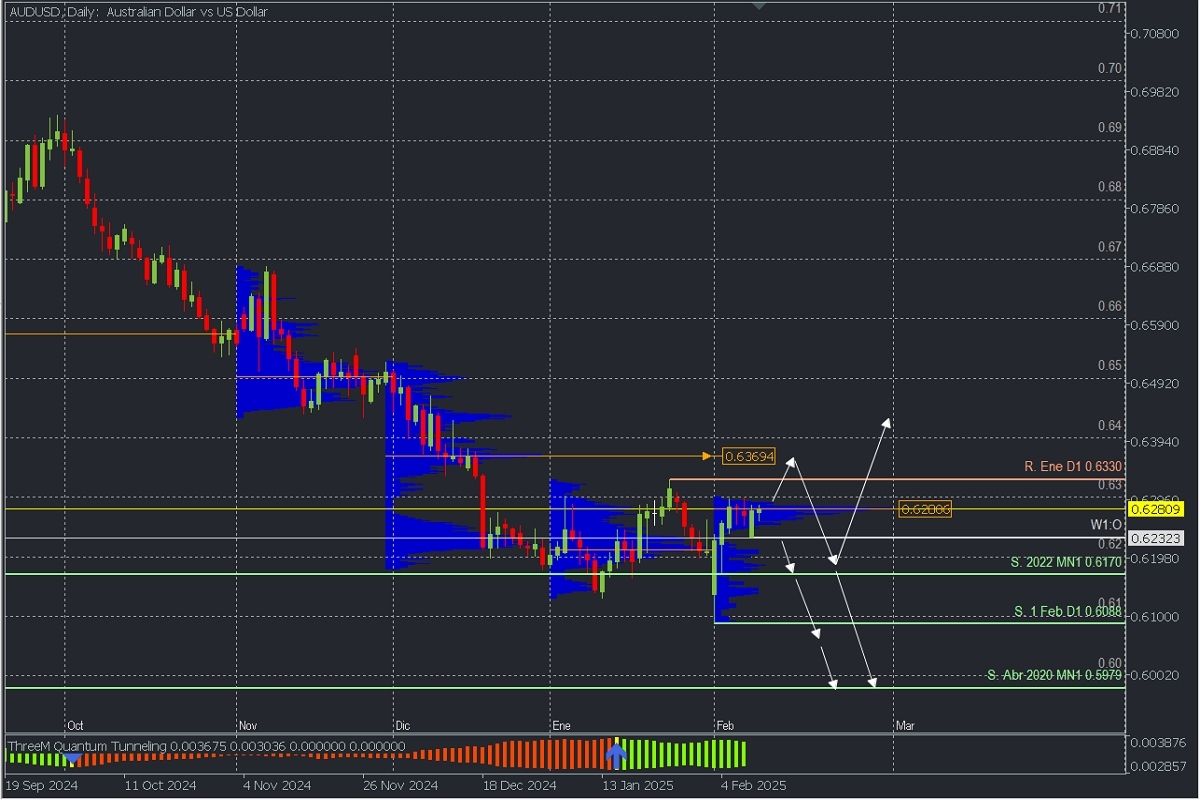
- Supply Zones (Sell): 0.6369 and 0.6280
- Demand Zones (Buy): 0.66
After breaking the 2022 support, the price is now at levels seen in April 2020, leaving daily support at 0.6088, which triggered the January high at 0.6330 as the last validated daily resistance. The current consolidation and correction are developing a volume concentration for February (not fixed until the month ends) around 0.6280, a potential supply zone that could trigger bearish activity early and renew selling towards 0.61 or the 2020 lows. This scenario will remain valid if the price does not break above this zone and the key resistance from January.
On the other hand, the potential rebound from the first break of the January resistance targets the macro supply zone in December around 0.6369, which is expected to be defended by bears to drive sales towards 0.62 at least, from where a bullish reversal or further bearish continuation will be assessed. The bearish continuation should break the 0.6088 support.
AUDUSD, H2
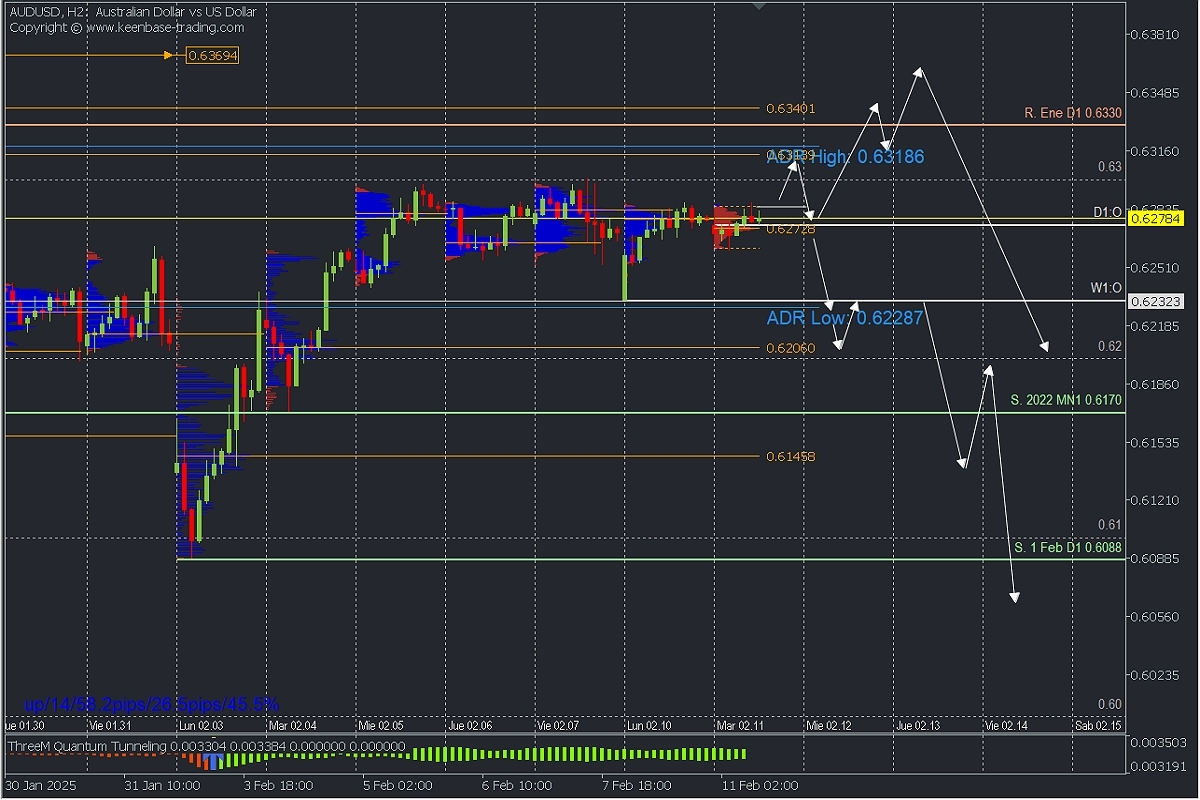
- Supply Zones (Sell): 0.6313, 0.6340, and 0.6369
- Demand Zones (Buy): 0.6272, 0.6206, and 0.6145
On an intraday basis, the price has consolidated for the fifth consecutive day below 0.63, with the last validated support at 0.6170. This implies that the correction will continue with an upward bias as long as this level is not broken.
In this sense, buying has struggled to break above the POC from the early sessions at 0.6272, but if we see a move above 0.6287, a rally towards the supply zone around 0.6318 is expected, where there is an uncovered POC and the average bullish range.
On the other hand, if the price drops below 0.6272, we do not rule out selling towards the weekly open (W1:O) at 0.6232 and, more extended, the uncovered POC at 0.6206, with potential for bearish continuation.
Technical Summary:
Corrective Bullish Scenario: Buy above 0.6287 with targets at 0.63, 0.6318, and potentially 0.6340
Bearish Continuation Scenario: Sell below 0.6272 with targets at 0.6232, 0.62, 0.6170, and 0.6145.
Always wait for the formation and confirmation of an *Exhaustion/Reversal Pattern (PAR) on M5, like the ones we teach here https://t.me/spanishfbs/2258 before entering any trades in the key zones we indicate.
*Uncovered POC: POC = Point of Control: It is the level or zone where the highest volume concentration occurred. If there was a bearish movement from this point, it is considered a sell zone and forms a resistance area. Conversely, if there was a bullish impulse, it is considered a buy zone, usually located at lows, thus forming support zones.


