Fundamental Factors Impacting Markets
- Tariff Chaos Dominates Headlines
- U.S. Tariff Changes:
- Universal import rate cut to 10% (except for China)
- China hit with 145% tariffs – confirmed by White House
- China's Retaliation:
- Boosted tariffs on U.S. goods from 84% → 125%
- Chinese finance ministry warned tariffs are becoming an economic "joke."
- Other Tariffs Still in Effect:
- 25% tariffs on aluminum, autos from Canada & Mexico (outside USMCA)
- 145% on China
- 10% on all other countries
- U.S. Tariff Changes:
- Uncertainty Remains Despite Diplomatic Moves
- EU's trade rep flying to Washington Sunday to potentially "sign deals"
- There is no clarity on whether the 90-day tariff reprieve will stick or expire with more chaos
- Analysts and fund managers warn temporary tariff pauses are not a resolution
- Economic Fallout
- Investors fear long-term inflation + slower growth
- Businesses and consumers lack confidence with short-term reprieves
- Jed Ellerbroek (Argent Capital): "Policies = higher inflation, lower growth, frustrated market."
- Market Sentiment Swings
- Traders switching rapidly between risk-on (Wednesday rally) and risk-off (Thursday plunge)
- Significant indices remain 7.1% down since the April 2nd tariff announcement
- High volatility likely to persist as policy headlines drive intraday momentum
Key Takeaway for Traders
- Markets are trying to stabilize after one of the most volatile weeks in years, but headline risk from tariffs is not priced in the long term.
- Relief rally may continue Friday if EU-U.S. trade news is positive, but the risk remains heavily skewed to the downside if talks stall or China retaliates further.
US100 – H4 Timeframe
.png)
The bullish break of structure on the 4-hour timeframe chart of US100 created a Fair Value Gap and was followed by a bearish retracement. In such scenarios, price is expected to be attracted to the FVG area, after which a reaction from the demand zone would serve as the entry confirmation. In this case, the highlighted demand zone overlaps the trendline support and serves as a critical area of confirmation.
US100 – H1 Timeframe
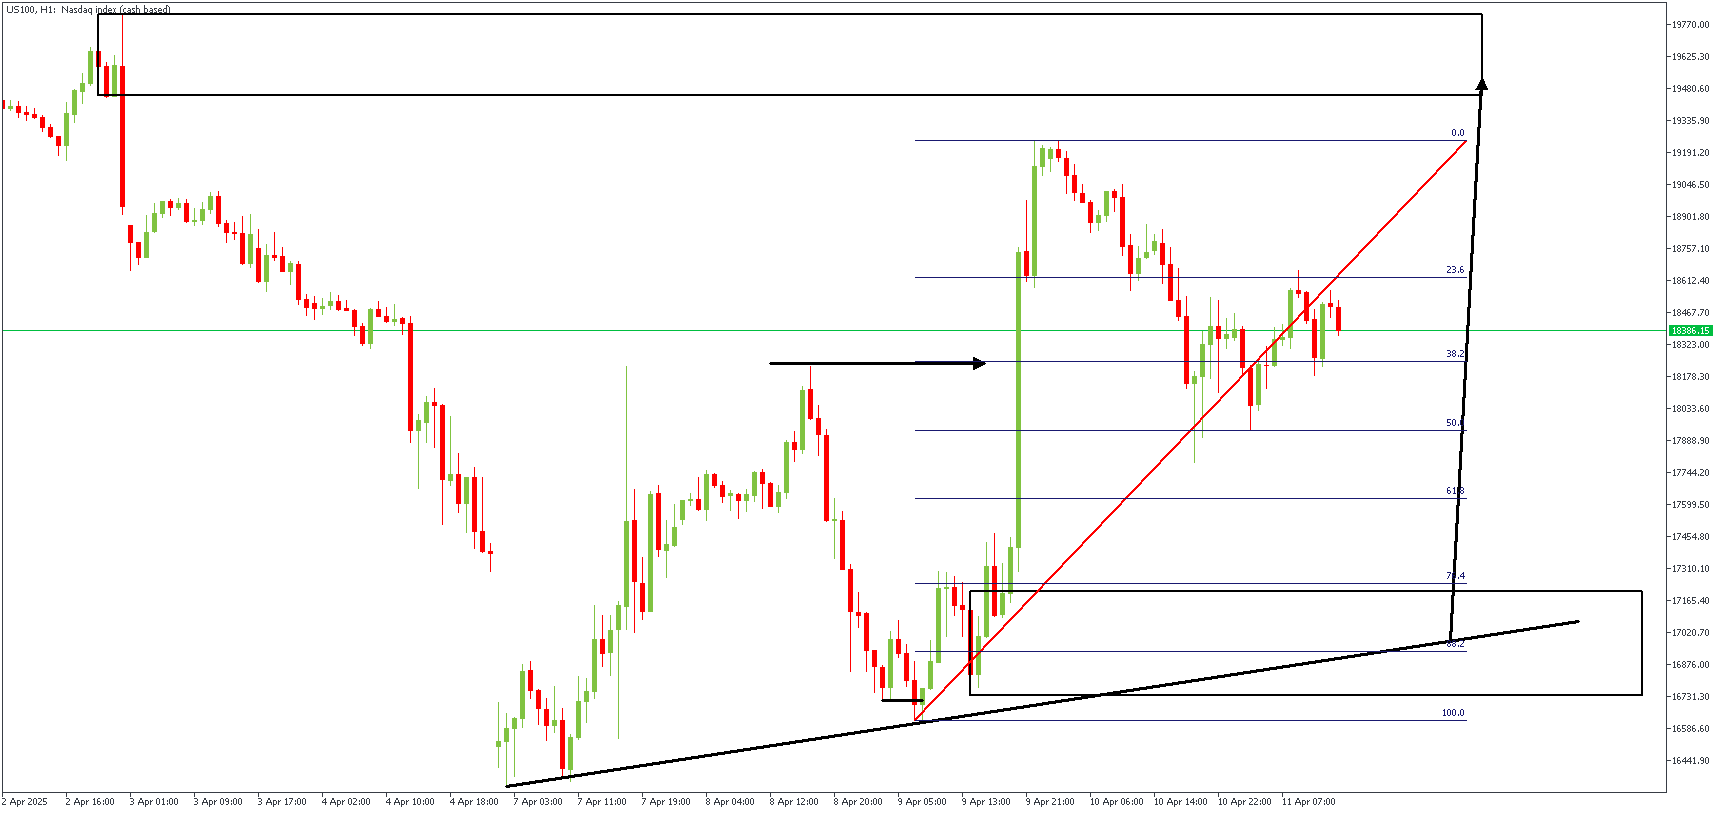
The 1-hour timeframe chart reveals the SBR pattern lurking behind the drop-base-rally demand zone. We also discover that the demand zone falls within the 76%- 88% Fibonacci retracement levels, another confirmation of bullish intent. Finally, trendline support is the final piece that brings the puzzle together.
Analyst's Expectations:
Direction: Bullish
Target- 19443.88
Invalidation- 1647.80
CONCLUSION
You can access more trade ideas and prompt market updates on the telegram channel.


